How to Get a Console Report from Most Common Browsers
The console tab in your browser allows you to view log messages and errors from a web page. The console report can give useful information when debugging or troubleshooting your form. This guide shows how to get the console report from your browser.
Google Chrome and Chromium-Based Web Browsers
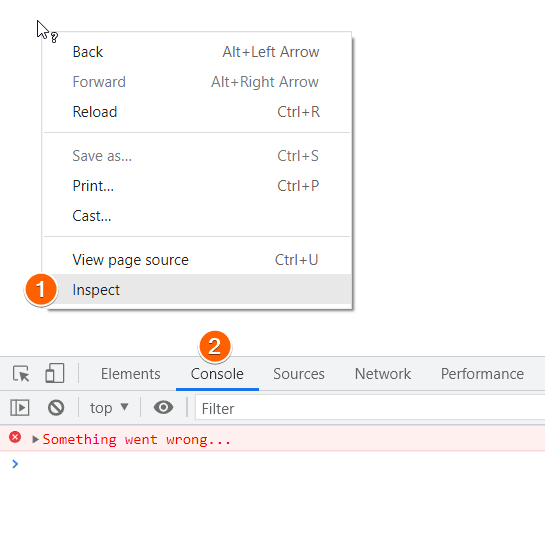
- Right-click on the page, then select Inspect from the menu to open DevTools.
- In DevTools, go to Console.

You can also use the keyboard shortcut Ctrl+Shift+J for Windows and Linux or Cmd+Option+J for Mac to open DevTools.
Mozilla Firefox and Firefox-Based Web Browsers
- Right-click on the page, then select Inspect from the menu to open Developer Tools.
- In Developer Tools, go to Console.

You can also use the keyboard shortcut Ctrl+Shift+K for Windows and Linux or Cmd+Option+K for Mac to open Developer Tools.
Safari
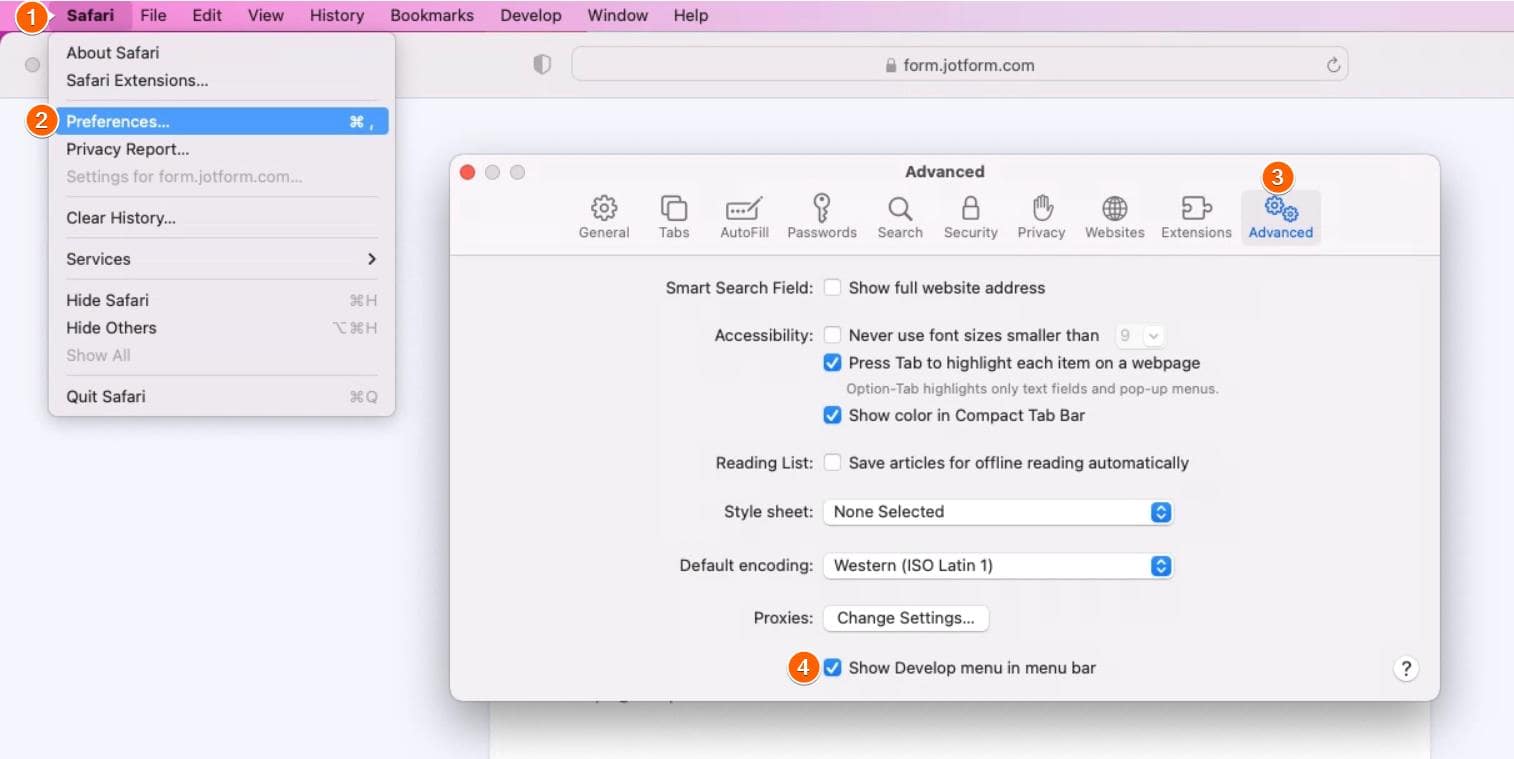
- Select Safari in the upper-left corner.
- Select Preferences from the menu, then go to Advanced in the dialog.
- Turn on Show Develop menu in menu bar, then close the dialog.

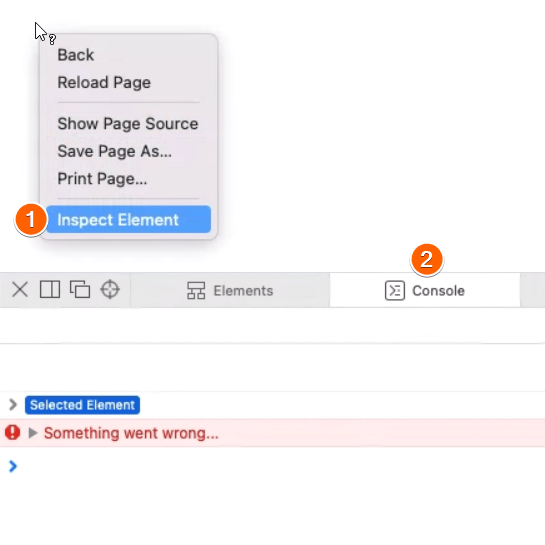
- Right-click on the page, then select Inspect Element from the menu to open Developer Tools.
- In Developer Tools, go to Console.

You can also enter Cmd+Option+C on your keyboard to open Developer Tools.
Internet Explorer
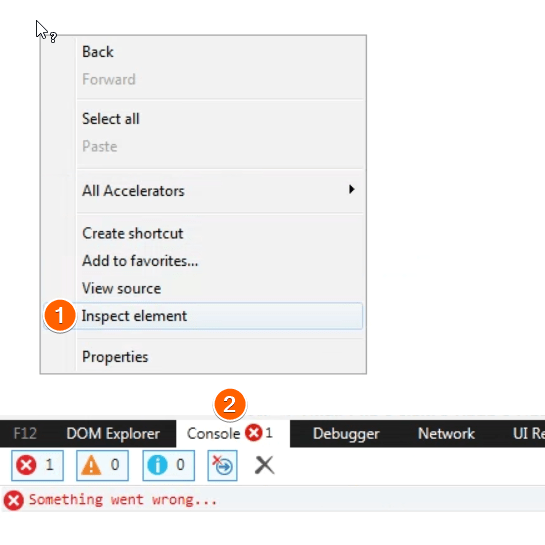
- Right-click on the page, then select Inspect element from the menu to open Developer Tools.
- In Developer Tools, go to Console.

You can also enter F12 on your keyboard to open Developer Tools.
